Using @RISK to Analyze Key Risk Factors and Schedule Risk
NASA and Lockheed Martin are working together to plan the first manned mission to Mars, a multi-staged project that requires careful scheduling and planning in order to meet milestones efficiently. The project relies on the power of @RISK to help determine key risk factors along the way and to analyze schedule risk – modeling how the different risk factors will impact the overall schedule of this program where every milestone is crucial, and millions are at stake.
Stepping Stones to Mars
Sending a person to Mars is not a simple task. Once the stuff of science fiction, visiting the red planet is now in the foreseeable future–thanks to engineers and analysts on the NASA and Lockheed Martin Orion team. “We are building the first stepping stones to Mars,” says Michael Watson, a senior member of the Lockheed Martin Space Systems Company Integrated Program Planning staff and part of the Master Planning team for the Orion program.
The Orion Multi-Purpose Crew Vehicle (MPCV) program is charged with building America’s next human exploration spacecraft, with the capability of taking humans into deep space, the moon, asteroids, and Mars.
A Multi-Stage Process
Before heading to Mars, the program must achieve several interim stages. The first is an unmanned test flight, called Exploration Flight Test 1 (EFT-1), which will achieve an orbit around Earth 3600 miles into space. “It’s going to go further than anyone’s gone in more than 40 years,” says Watson. “The last manned spacecraft that went that deep into space was the Apollo program.” The EFT-1 of Orion will return to Earth at a speed of almost 20,000 mph and endure temperatures of 4,000⁰ F before splashdown in the Pacific Ocean. The mission will provide engineers with critical data about Orion’s heat shield, flight systems, and capabilities to validate designs of the spacecraft before crewed flights.
The EFT-1 will be followed by Exploration Mission-1 (EM-1), an unmanned, 25-day mission which will circle around the moon and back. The next step, slated for 2021, is Exploration Mission-2 (EM-2), which will take astronauts to explore nearby asteroids. With so many stages, expensive technology, and a high-risk mission, risk forecasting is mandatory. So Watson and his colleagues have used @RISK to plan and analyze potential challenges with the current stage of the program, EFT-1, and how those challenges will affect the overall Orion program schedule.
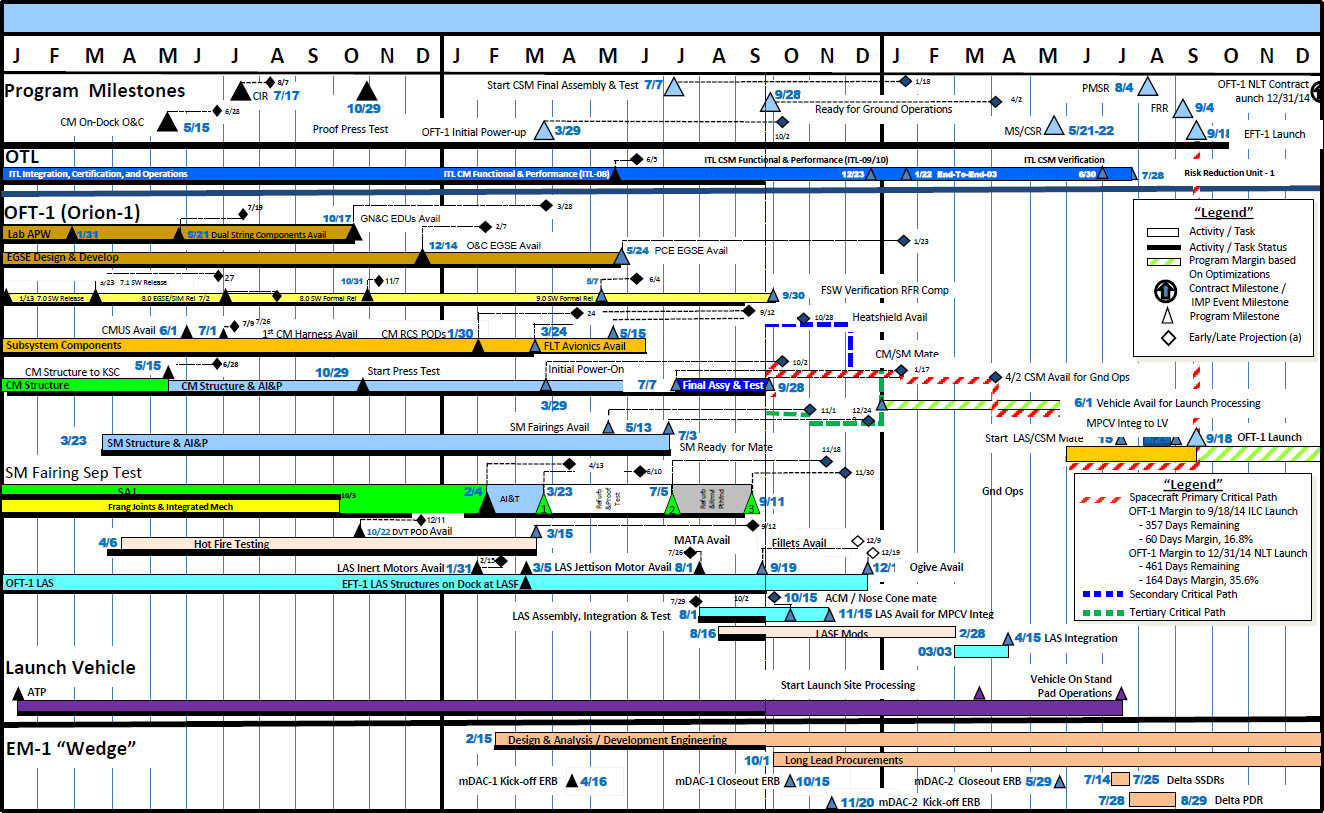
The Orion Program Summary Master Schedule—a bird’s-eye view of the program’s next three years
Determining Risk Factors and Schedule Risk
To arrive at quantitative risk factors, Watson and colleagues needed data on the likelihood of risks and their potential consequences. To do this, they first established typical attributes associated with design, production, test and verification. They then assigned ‘Probability of Occurrence’ ratings to these attributes. For example, new hardware that had only been designed in theory had a probability occurrence of 0.90, while hardware that already existed and was immediately functional was given a probability occurrence score of 0.0.
They went through the same process for ‘Consequence Factor’ ratings. For example, certain program-threatening impacts that could cause 4.5 months of time delay and cost up to $90K have a rating of 0.90, while an impact that would not change the schedule at all and costs nothing has a rating of 0.00. These scores for occurrence and impact were derived from 40 years of historical data from previous missions, and from talking with engineers and managers. “We talked with them and tried to remove all the biases from their reports,” says Watson. “We would ask them if they’ve ever built something like this before, and it gives you a nice scoring method.”
Once those scores are established, Watson and his colleagues would take the sum of the probability occurrence and multiply that by the sum of the consequence factor to arrive at the risk factors. The risk factors range from 1-8, from a routine task with a “low” level of uncertainty, to a task in which their engineers have no experience and a “very high” level of uncertainty.
With these risk factors in place, Watson then creates a schedule of every task – the Integrated Master Schedule (IMS) – so that a risk factor is assigned to each task in the multi-year project. The team also estimates the duration of every task, with a minimum, maximum, and a most likely duration length.
Integrated Program Planning - NASA Orion Multi-Purpose Crew Vehicle, Lockheed Martin
Using @RISK to Improve the Process
With the risk factors defined and the schedule in place, Watson and his colleagues turn to Lumivero software. “We turn on @RISK’s Monte Carlo simulations, and it tells us key information on major milestone points,” says Watson. “We want to know when we will hit our milestones—for example, launch is extremely important—so we need to know what it’s going to take to hit them on time.”
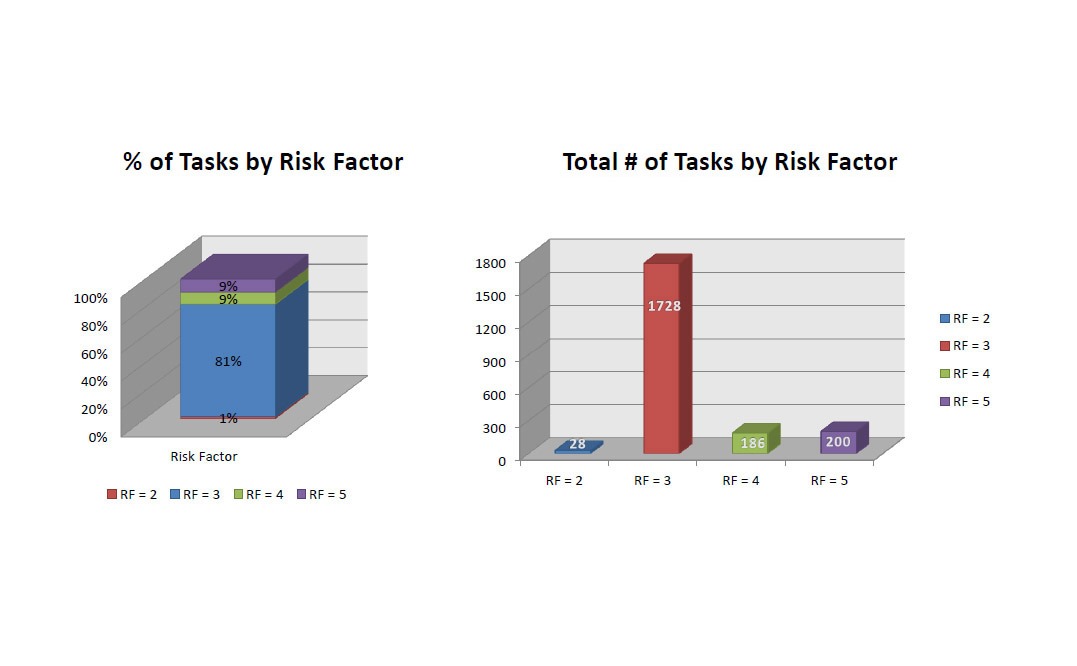
@RISK provides graphs that display what percentage of tasks fall into certain risk categories, as well as the total number of tasks with a certain risk factor.
By running regular schedule risk assessments with @RISK, Watson and his team can continuously validate the model to see if it’s accurate. “We go back and do some forensics,” explains Watson. “We look and see which factor might be causing delays, and how we can do a better job moving forward. We do this process every month, and it gets quite a bit more accurate as we go.”
The team does this by examining graphs that delineate, for example, the percentage and number of completed tasks that were within the estimated minimum/maximum duration range to see how well the model predicts the actual outcome of the project. “If we see that we’re running into problems, we can then go back and alter our approach to the model,” says Watson. “Stepping back a few levels in analysis can reveal pervasive issues throughout the model.”
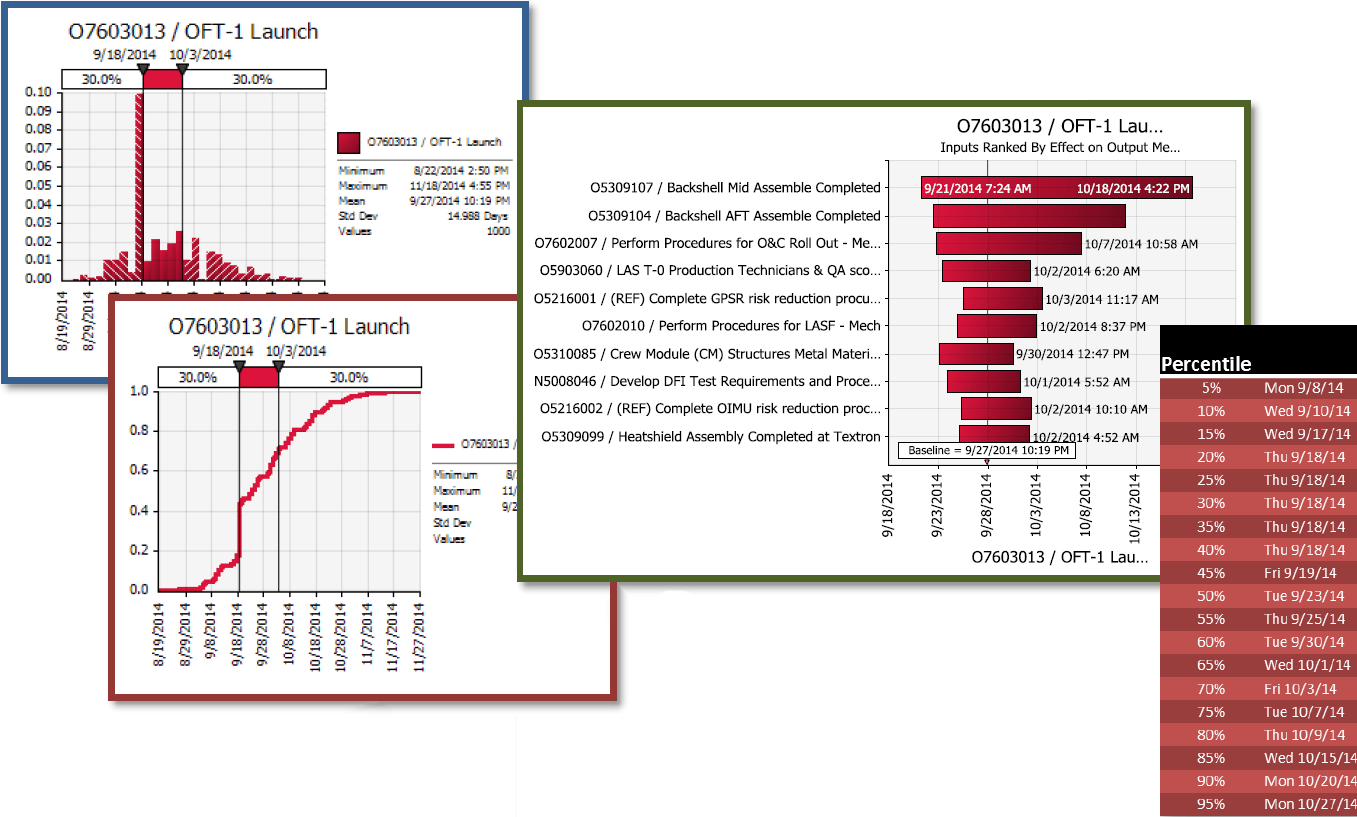
@RISK charts showing how schedule tasks affect overall outcome, and likelihood of meeting milestones.
To take this analysis to the next step, Watson’s team charts the milestones’ historical S-curves to see how close each iteration of the model gets to an accurate prediction. As the model is continuously refined, the probability of hitting their milestones correctly becomes more and more likely.
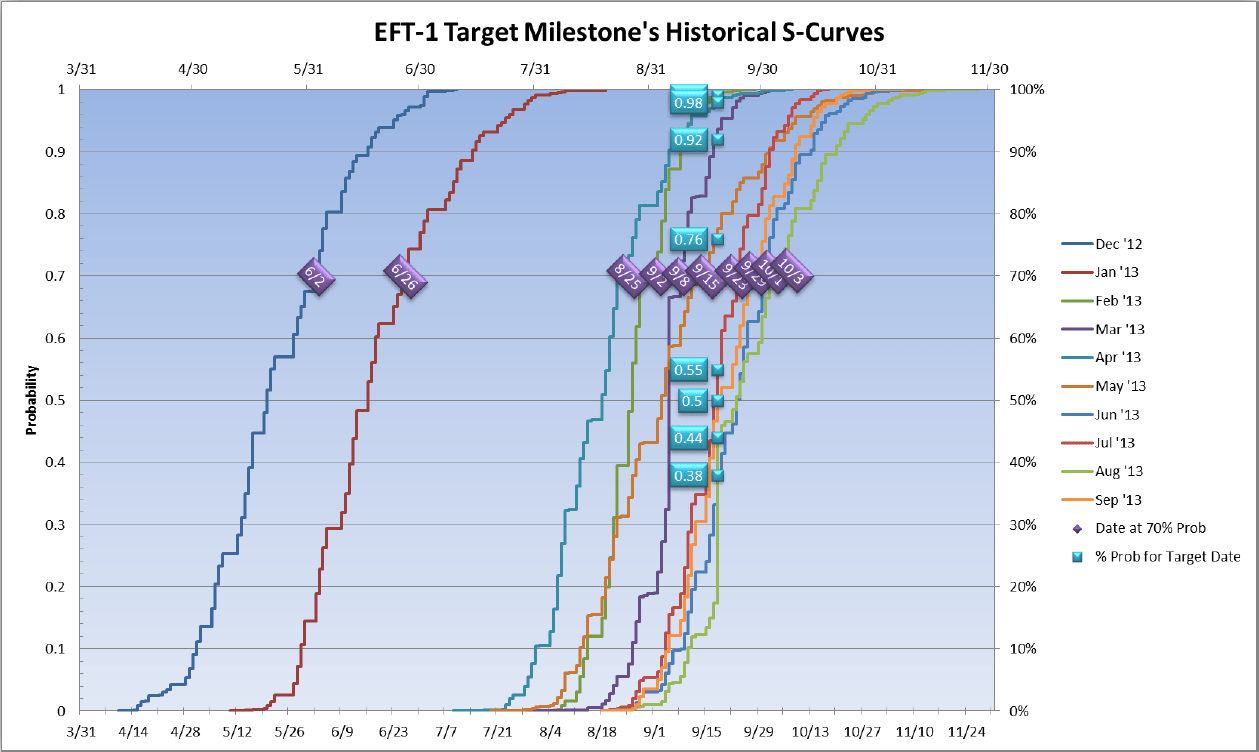
@RISK-generated S-curves depicting increasing accuracy of schedule modeling.
Watson says @RISK makes evaluating schedule risk much more efficient. “(@RISK) software really makes it a lot easier to handle large, complex systems in data analysis,” he says. “It tells us the probability of making our contractual dates, highlights any areas of risk that we may not have identified, and also provides us with forensic data to look back at for other areas of opportunities.” Step by step, @RISK is playing a part in the first manned mission to Mars.
Published: Dec. 17, 2021
Updated: Sept. 1, 2023
ScheduleRiskAnalysis
Manage Uncertainty in Project Schedules
Start analyzing your schedule risk using Monte Carlo simulation with @RISK's ScheduleRiskAnalysis (SRA). SRA shows you virtually all possible outcomes in your schedule – and tells you how likely each is to occur. Plus, it works within the familiar Excel environment and lets you perform risk modeling on project files created in Primavera P6 and Microsoft Project.
Request a Demo of DecisionTools Suite and access example models, case studies, webinars and more on the Lumivero resource page.